
1. The four stages of bearing failure
In the field of vibration, it is generally accepted that the spalling process of bearings is divided into four stages: from the first microscopic sign to the severely damaged bearing. Some people divide the process into more than four stages, with finer increments, but the process is still the same.
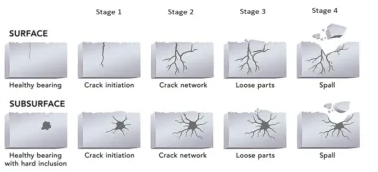
FIG. 1 Bearing failure process is divided into four stages
The process began slowly; The time spent in stage 1 and stage 2 is longer than that in stage 3, especially stage 4, and the speed of damage process is accelerated in the later stage.
Imagine bearings that carry heavy loads; The surface of the bearing load area must be subjected to great stress for a long time. The contact line between the roller and the outer or inner ring in the roller bearing or the contact point in the ball bearing has a very high pressure. Bearings are designed to withstand such large stresses, but even new, high-quality bearings have surface defects, such as microscopic cracks. The enormous pressure generated when the rolling element passes through these defects, pushing down on the lubricating medium, sometimes enlarges these microscopic cracks. When the roller in the rolling element bearing passes through these points, the loading/unloading force acts on these cracked areas, and the friction between the metal parts (or the microscopic surface contact between the parts in the cracked area) emits an elastic wave. This process leads to crack propagation. This is typical stage 1 and stage 2 behavior.
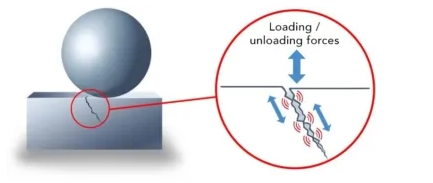
FIG. 2 Early bearing failure in stages 1 and 2
In the third and fourth stages, there are more collisions between the corners of the rolling body and the loose parts. In the fourth stage, the rolling body no longer produces many elastic waves; When the rollers fall into the pits due to old, worn flaking, it is more like a mass movement.
The elastic wave emission in different stages of bearing failure is summarized: in stage 1 and stage 2, the elastic wave is mainly generated by the loading/unloading force in the region with microscopic cracks. The source of the waves is the microscopic collision of metal parts caused by shear forces. In stage 3, there are more actual collisions between rolling elements and loose parts or newly peeled corners. In stage 4, when the rolling element follows the damage profile, the elastic wave strength decreases while the pure vibration signal increases.
There may be other causes of bearing failure, such as contamination of the lubricating medium, small pollutant particles adhering to the bearing surface leading to the emission of strong elastic waves. Another potential cause of bearing failure is electrical corrosion, where discharges create a characteristic undulating pattern on the bearing surface. In this case, no elastic waves are emitted and damage is only visible in the speed reading.
Elastic waves (or compression waves) are generated when two metal objects collide, such as when a roller in a rolling bearing hits the corner of a raceway crack, or when friction occurs due to shear forces on a metal part. These waves typically travel at a speed of 6,000 m/s (20,000 ft /s) in steel. The speed of sound in air is 340 m/s (1,100 ft /s), which is 18 times slower than waves in steel. These elastic waves typically have very low energy levels compared to low-frequency signals stemming from unbalance, misalignment, belt problems, and gear engagement. Elastic waves follow the machine structure and are damped by the material interface.
In contrast, "normal" low-frequency vibration signals are more of a mass motion and are clearly directional, while elastic waves can "propagate in the corner" (i.e. pick up sound from a very wide area). Elastic waves can be thought of as "ripples" in a material. In most real-world machines, low-frequency signals and elastic waves occur simultaneously.
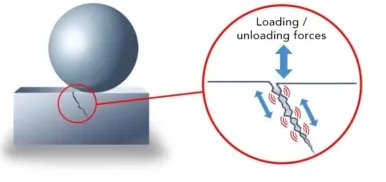
FIG. 3 Omnidirectional elastic wave generated by impact
Further study of these elastic waves revealed that they are transient signals with short rise and fall times and therefore contain energy over a very wide frequency range well above 40 kHz.
Imagine that the vibration sensor is installed close to the bearing load area (Figure 4). Also imagine a spectral analysis of the sensor output signal as the rolling element passes through a specific location on the outer ring. The spectrum analysis is based on a very short time frame, capturing only the exact moment when a rolling element passes through a specific location.
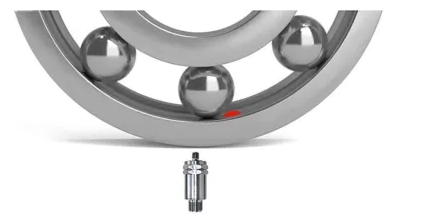
Figure 4 Vibration sensor installed near bearing load area
In healthy bearings, the signal is usually completely dominated by low-frequency signals, such as unbalance, belt vibration, misalignment and similar sources. Typically, the material interface between the rolling element and the outer ring also produces an extremely weak signal. Tiny (microscopic) surface bumps collide and emit weak elastic waves. These elastic waves are orders of magnitude weaker than low-frequency signals. Because these elastic waves are very "sharp" (short rise and fall times), they also contain energy at the high end of the spectrum. It can be said to be like "mechanical background noise" in the spectrum.
Figure 5 below shows a "snapshot" of the spectrum when the rolling element is near a vibration sensor in a healthy bearing. This mode is usually dominated entirely by low-frequency signals (unbalanced, misaligned, and similar sources represented as 1X, 2X). Very weak broadband "mechanical background noise" is shown in red. "Mechanical background noise" depends on lubrication.
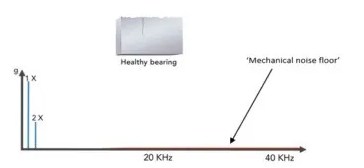
Figure 5 Spectrum of healthy bearing
In the first stage of bearing failure, when one or more microscopic cracks expand, the loading and unloading process (when the rolling element passes through an area with microscopic cracks) generates elastic waves. These waves originate primarily from small surface collisions as metal parts move relative to each other (see Figure 3). The energy content of these elastic waves is still low in the first stage, but can be measured. The signal pattern is still completely dominated by low-frequency energy from unbalanced and similar sources (expressed as 1X, 2X), as shown in Figure 6.
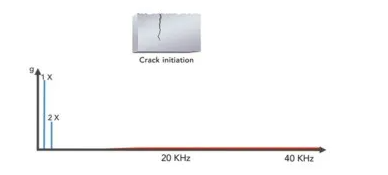
Figure 6 Spectrum of the first stage
In the second stage of bearing damage, microscopic cracks have formed a crack network. The loading/unloading process produces stronger elastic waves because there are now more semi-loose parts under the surface and greater relative motion. "Mechanical background noise" has grown in the spectrum, but is still weak. At this stage, the strength of the wave is sufficient to trigger the natural frequency of the bearing assembly. The bearing natural frequency depends on the size of the bearing and how it is mounted. Typically, the natural frequency can be found in the range of 2-6 KHz.
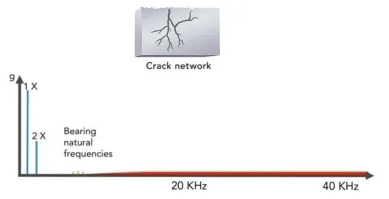
Figure 7 Phase 2 spectrum
In the third stage of bearing failure, the network of cracks leads to a larger number of loose or semi-loose parts. Elastic waves are produced by collisions between rolling elements and parts. The natural frequency of the bearing is now stronger (because the elastic wave contains more energy), and the "mechanical background noise" peaks, as shown in Figure 8.
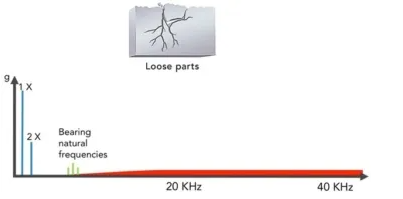
Figure 8 Phase 3 spectrum
In the fourth stage, the spalling has become a large pit, and by the end of the fourth stage, the sharp corners have all worn away. The rolling element part follows the spalling profile and therefore produces a vibration (inelastic wave) whose frequency corresponds to the bearing frequency (BPFO, BPFI, BS, FTF).
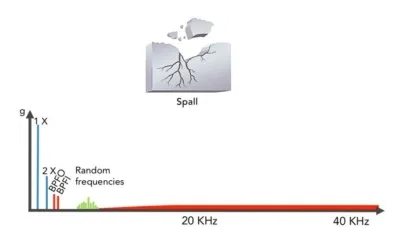
Figure 9 Phase 4 spectrum
Refer to the red spectrum lines (BPFO, BPFI) representing the bearing frequencies in Figure 9: How can early damage in stages 1, 2 and 3 be detected if the bearing frequencies only occur in the stage 4 spectrum? This is a common misconception. As the rolling element passes through the damaged area of the first stage, "mechanical background noise" increases each time it passes through that particular location. The bearing frequency can be shown by looking at frequencies above, say, 10 kHz and measuring the frequency of occurrence of elevated background noise. Another way to describe it is that the mechanical background noise is modulated by the bearing frequency.
For example, the bearing BPFO of a machine running at 1500 RPM = 5.7. This means that the roller passes 1500*5.7/60 = 142.5 times per second in a position on the outer ring. This is equal to 142.5 Hz. The spectrum below is a typical phase 1 pattern, in which the intensity of red mechanical background noise increases and decreases 142.5 times per second. 142.5Hz is the frequency of the outer ring signal.
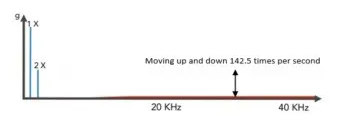
Figure 10. Phase 1 noise modulation
Historically, gear and bearing damage detection using standard speed readings (i.e., overall speed values) can, at best, reveal serious damage at a very late stage, resulting in very limited planning scope. At best, the tendency of the speed RMS value to increase can be used to avoid unexpected stops.
Adding spectral analysis based on speed readings can reveal gear and bearing damage much earlier than in the final stage, but it's still a pretty crude tool.
When vibration envelopes were introduced decades ago, damage could be detected much earlier than before, and then actual warning times could be discussed. With a vibration envelope, information from gears or bearings can be extracted even if the sensor signal is dominated by low-frequency content that typically comes from unbalanced forces.